MajorLevels FX (MT4)
This indicator plots major institutional price levels for currencies. It includes various round-price-numbers referred to as ‘major quarters, major wholes, minor quarters, and minor wholes’ that will automatically be displayed based on the current chart interval being viewed.
- Customizable display formatting
- Profit-zone highlight overlay
AnchorTrend™ (MT4)
Anchor Trend is a unique trend analysis system that focuses on the directional sentiment of current price action using OHLC data.
Once learned and applied accurately, a trader can easily assess the current trend in any market. This indicator will enhance your analysis of Anchor-Trend by validating and significantly speeding up your process.
- Display Anchor boundaries
- Paint candle colors based on trend
- Display trend key history
- Display beginner learning symbols
NOTE: This product is intended for use as part of the Meat & Potatoes trading system and is intended for use by traders familiar with that system.
Level Break (MT4)
Level Break Count “LBC” calculates and tracks the number of “breaks” of historical price levels based on OHLC price action. It displays a conditional color-painted oscillator on the chart sub-graph to provide signals to the user. The oscillator provides a quick visual means for identifying trend strength, potential trend continuations, and turnaround points.
Features include optional style formatting along with custom level & signal settings.
NOTE: This product is intended for use as part of the Meat & Potatoes trading system and is intended for use by traders familiar with that system.
Unfilled Orders (FXTS)
Unfilled Orders uses historical price action to calculate and track areas where unfilled buy and sell orders may still remain. This information is displayed in a panel on the right side of the chart and allows users to quickly determine when price is entering a potential area of supply or demand imbalance. Features include custom panel styling and width, and a unique historical mode to view historical unfilled orders.
NOTE: This product is intended for use as part of the Meat & Potatoes trading system and is intended for use by traders familiar with that system.

AnchorTrend™ (FXTS)
Anchor Trend is a unique trend analysis system that focuses on the directional sentiment of current price action using OHLC data. Once learned and applied accurately, a trader can easily assess the current trend in any market. This indicator will enhance your analysis of Anchor-Trend by validating and significantly speeding up the analysis process.
- Display Anchor boundaries
- Paint candle colors based on trend
- Display trend key history
- Display beginner learning symbols
- Multi-Time-Frame ready
NOTE: This product is intended for use as part of the Meat & Potatoes trading system and is intended for use by traders familiar with that system.
Major Levels FX (FXTS)
This indicator plots major institutional price levels for currencies. It includes various round-price-numbers referred to as ‘major quarters, major wholes, minor quarters, and minor wholes’ that will automatically be displayed based on the current chart interval being viewed.
- Customizable display formatting
- Profit-zone highlight overlay

FXCM API Plugin (AnchorTrend Scanner)
This plugin adds support to the CDX Trend Scanner for connecting with the popular FXCM API. Now you can use your Live or Demo FXCM account to pull the exact same forex data as you see in charts on the FX Trading Station platform.
AnchorTrend Scanner

ATR Box Draw-Tool (NT8)
Custom Drawing Tool:
This app provides the ability to instantly draw rectangles on the chart sized to a specific ATR(Average True Range) value. It features several style options including configurable ATR factors and configurable colors.
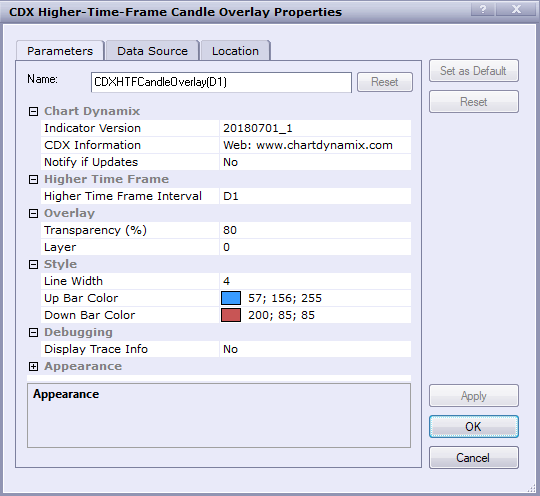
Candle Overlay (FXTS)
Displays a higher-interval candle chart overlay with semi-opacity on the currently viewed chart. Great for multiple-time-frame analysis!
– Choose from a variety of formatting options including color and transparency
– Keep a birds eye view on the big picture while watching live price action unfold
– Toggle High/Low wicks on and off